


Learning how to read a water filter test report helps you separate meaningful performance data from an impressive-looking percentage or marketing claim. A useful laboratory report should tell you what entered the filter, what remained after filtration, how the reduction was calculated, which test conditions were used, and what standard or health benchmark applies.
The most important terms are:
-
Influent: The contaminant concentration entering the filter
-
Effluent: The concentration leaving the filter after treatment
-
Reduction percentage: The portion of the influent concentration reduced by the filter
-
Detection limit: The lowest concentration at which the analytical method can distinguish the presence of a substance under defined conditions. Reporting and quantitation limits may be higher and should be checked separately.
-
Benchmark: The NSF/ANSI requirement, EPA regulatory level, or other comparison value used to interpret the result
These values must be read together. A 99% reduction does not automatically mean the finished water meets a relevant benchmark, while a result marked “ND” does not necessarily mean the contaminant is completely absent.
Understanding What a Water Filter Test Report Actually Shows
A water filter laboratory report documents how a specific filter performed under defined testing conditions. Depending on the document, it may be called a:
-
Laboratory test report
-
Contaminant reduction report
-
Performance data sheet
-
Substance reduction test
-
Product performance report
-
NSF/ANSI test report
The report generally compares challenge water before treatment with filtered water afterward. It may also show flow rate, pH, water temperature, test capacity, sampling points, analytical methods, and the standards used to evaluate performance.
Water Filter Laboratory Report vs. Water Quality Test Report
These two documents answer different questions.
A water quality test report analyzes a sample from a particular source, such as a private well, household faucet, or municipal supply. It tells you what was found in that sample at that time.
A water filter performance report evaluates a treatment device. The filter is usually exposed to prepared challenge water containing specified contaminant concentrations. The report then measures how effectively the system reduces those contaminants under controlled conditions.
|
Report type |
Primary question |
Typical information |
|
Water quality test report |
What is in this water sample? |
Detected contaminants, concentration, reporting limit, applicable benchmark |
|
Water filter performance report |
How did this filter perform under the test conditions? |
Influent, effluent, reduction rate, test protocol, capacity and operating conditions |
|
Certification performance data sheet |
What claims are covered by a certification? |
Certified model, standard, specific reduction claims, rated capacity and required conditions |
A filter report does not tell you what is currently in your tap water. Likewise, a household water test does not prove that a particular filter can address the contaminants found.
For a practical treatment decision, you usually need both pieces of information: the contaminants present in your water and verified performance data for the exact filter being considered.
The Five Values to Check First
When opening a report, locate these five items before evaluating any headline claim:
-
Contaminant: What substance was tested?
-
Influent concentration: How much was present before filtration?
-
Effluent concentration: How much remained after filtration?
-
Reduction rate: What percentage was reduced?
-
Benchmark: What pass/fail requirement, maximum effluent value, or regulatory reference applies?
A percentage without influent and effluent concentrations is incomplete. An effluent number without units is equally difficult to interpret.
What Laboratory Results Can—and Cannot—Tell You
Laboratory results can provide credible evidence that an identified system reduced specified contaminants under the stated conditions. They can also show whether performance was maintained at different stages of the filter’s rated service life.
They cannot automatically establish that:
-
The same result applies to every model from the manufacturer.
-
The filter reduces contaminants not included in the report.
-
Household water will match the laboratory’s challenge water.
-
Performance will remain unchanged if the filter is improperly installed or used beyond its rated capacity.
-
The finished water is safe for every possible chemical or microbiological concern.
-
A one-time laboratory test is equivalent to third-party product certification.
Treat the report as specific evidence—not a blanket guarantee.
Anatomy of a Water Filter Performance Data Sheet
Before reading individual contaminant rows, confirm that the document actually applies to the product and configuration you are evaluating.

Confirm the Exact Model, Cartridge and Configuration
Look for the complete system model number, cartridge designation, and any required components. Similar names do not prove that two products have identical performance.
Check whether the tested configuration included:
-
A prefilter or sediment stage
-
A carbon cartridge
-
A membrane
-
A post-filter
-
A storage tank
-
A particular faucet, housing or flow-control device
This is especially important for multi-stage systems. Removing, substituting, or rearranging components may change the system from the configuration used in the test.
Identify the Laboratory, Date and Protocol
A useful report should name the laboratory or certification organization and identify the test date or report number. It should also state the protocol or standard used.
Look for wording such as:
-
Tested according to a specified NSF/ANSI protocol
-
Evaluated for a named contaminant reduction claim
-
Certified to a stated NSF/ANSI standard
-
Tested using a laboratory-defined method
These phrases are not interchangeable. “Tested according to” describes a test method. “Certified to” indicates that a certification body evaluated the product under a formal certification program.
The date matters because products, cartridges and certification listings can change. A current product should be matched to current documentation.
Read the Table, Footnotes and Pass/Fail Criteria
The main contaminant table may show:
-
Contaminant name
-
Test standard
-
Average or maximum influent
-
Average or maximum effluent
-
Minimum or average reduction
-
Required reduction
-
Maximum permissible effluent
-
EPA benchmark
-
Pass/fail result
Do not stop at the table. Footnotes may explain that:
-
Acceptance was based on a percentage rather than a maximum effluent concentration.
-
A result was below the analytical reporting limit.
-
Values are averages from multiple samples.
-
Testing occurred at more than one pH.
-
A reduction claim applies only to a named model or cartridge.
-
The system was tested through a specified capacity.
A clean-looking percentage can be misleading if the footnotes change how it should be interpreted.
Check the Units: mg/L, µg/L, ppm and ppb
Concentrations must be in the same units before you calculate or compare them.
For water-based measurements:
-
1 mg/L is approximately 1 part per million (ppm)
-
1 µg/L is approximately 1 part per billion (ppb)
-
1 mg/L = 1,000 µg/L
For example, 0.005 mg/L equals 5 µg/L. Comparing 0.005 mg/L directly with 5 mg/L would create a thousandfold error.
Particle counts, cyst counts and microbiological results may use different units or logarithmic reduction values. Do not apply the standard chemical percentage formula unless the report presents comparable before-and-after quantities.
Review Test Conditions
Filter performance is influenced by the conditions under which the test was conducted. Look for:
-
Flow rate
-
Feed-water pressure
-
Water temperature
-
pH
-
Hardness or dissolved solids
-
Challenge concentration
-
Test duration
-
Volume treated
-
Sampling schedule
Challenge water is often intentionally prepared to contain a contaminant at a concentration specified by a test protocol. That concentration may be higher than, lower than, or simply different from the amount in your tap water.
Find Rated Capacity and Lifecycle Test Points
A result measured shortly after installing a new cartridge does not show whether performance continues near the end of its rated capacity.
A stronger performance report shows testing at multiple points during the service cycle. Check for:
-
Initial sampling
-
Intermediate samples
-
Samples near rated capacity
-
The total volume processed
-
Any conditioning or flushing period
-
Whether final acceptance was based on the worst, maximum or average result
Rated capacity is model-specific. It should not be interpreted as a universal replacement interval because actual use and water conditions can affect service life.
Water Filter Lab Report Field Checklist
|
Field |
What to verify |
Why it matters |
|
Product identity |
Exact model and cartridge |
Results may not apply to similar products |
|
Laboratory or certifier |
Named organization |
Establishes who performed or oversaw the evaluation |
|
Test date and report number |
Current, traceable documentation |
Helps confirm relevance and authenticity |
|
Protocol |
Exact NSF/ANSI standard or other method |
Defines how testing was conducted |
|
Influent |
Before-treatment concentration |
Establishes the challenge level |
|
Effluent |
After-treatment concentration |
Shows what remained |
|
Reduction |
Average, minimum or calculated percentage |
Indicates relative treatment performance |
|
Units |
mg/L, µg/L, ppm, ppb or another unit |
Prevents calculation and comparison errors |
|
Benchmark |
Maximum effluent or required reduction |
Shows what constitutes passing |
|
Test conditions |
Flow, pH, temperature and pressure |
Defines the limits of the result |
|
Capacity |
Volume and lifecycle test points |
Shows whether performance was sustained |
|
Footnotes |
Exceptions and calculation rules |
May materially change the interpretation |
What Do Influent and Effluent Mean in a Water Filter Test?
The difference between influent and effluent is the foundation of water filter lab results.

Influent: Water Entering the Filter
Influent is the challenge water entering the treatment system. The influent column shows the concentration of the contaminant before filtration.
It may be labeled:
-
Influent
-
Unfiltered
-
Feed water
-
Challenge water
-
Average influent
-
Maximum influent
The influent establishes the starting point for the test. Without it, you cannot independently verify the reduction percentage.
Effluent: Water Leaving the Filter
Effluent is the water leaving the system after treatment. The effluent concentration represents the amount of the tested contaminant that remained.
It may be labeled:
-
Effluent
-
Filtered
-
Product water
-
Treated water
-
Average effluent
-
Maximum effluent
For practical interpretation, the effluent is often more important than the reduction percentage alone. It can be compared with a certification requirement, EPA benchmark, or another applicable guideline.
Influent vs. Effluent in a Typical Table
Consider this illustrative example:
|
Contaminant |
Influent |
Effluent |
Published reduction |
|
Example substance |
100 µg/L |
2 µg/L |
98% |
The filter received water containing 100 µg/L of the substance and produced water containing 2 µg/L under the test conditions. The difference—98 µg/L—represents a 98% reduction.
These numbers are examples only. They do not describe any particular product or establish a requirement for a real contaminant.
Challenge Concentration vs. Your Tap-Water Level
Do not assume the influent value in a performance report is a measurement of ordinary tap water. In standardized testing, the influent may be prepared to meet a required challenge concentration.
This creates two important limitations:
-
A filter tested at one concentration has not necessarily been evaluated at every possible concentration.
-
The reduction percentage does not tell you your likely effluent unless you know your own starting concentration and the filter behaves similarly under your water conditions.
A performance report shows how the filter performed under the stated test conditions. When testing follows a standardized protocol, the results can also be evaluated against that protocol’s defined criteria. A household water test establishes local relevance.
Average, Maximum and Individual Results
Reports may publish average values even when multiple samples were collected. Check whether the table shows:
-
Average influent
-
Average effluent
-
Maximum effluent
-
Minimum percentage reduction
-
Individual sample results
An average can hide a higher individual effluent result. For health-related reduction claims, pay close attention to the maximum effluent and pass/fail criteria—not only the average.
How Is Contaminant Reduction Percentage Calculated?
The standard calculation is:
Reduction percentage = (Influent − Effluent) ÷ Influent × 100
Both values must refer to the same contaminant and use the same units.
Worked Reduction-Percentage Example
Suppose a report shows:
-
Influent: 50 µg/L
-
Effluent: 1 µg/L
The calculation is:
(50 − 1) ÷ 50 × 100 = 98%
The reported reduction should therefore be 98%, subject to the report’s rounding rules.
How to Verify a Published Reduction Rate
Use this process:
-
Confirm that influent and effluent use the same units.
-
Determine whether the report uses average, maximum or individual results.
-
Subtract effluent from influent.
-
Divide the difference by influent.
-
Multiply by 100.
-
Compare your answer with the published percentage.
-
Read the footnotes for rounding or non-detect rules.
A small difference may result from rounding. A large difference may mean the report used underlying values with more decimal places, a different set of samples, or a calculation method explained elsewhere.
Why 99% Reduction Does Not Always Mean the Same Water Quality
Percentage reduction is relative to the starting concentration.
For example:
-
Reducing 10 µg/L by 99% leaves 0.1 µg/L.
-
Reducing 1,000 µg/L by 99% leaves 10 µg/L.
The same percentage produces very different effluent concentrations. That is why the question is not simply, “Is 99% good?” It is:
What was the influent, what remained in the effluent, and does the effluent meet the relevant requirement?
Percentage Reduction vs. Maximum Allowable Effluent
NSF/ANSI requirements differ by contaminant and standard. A claim may be evaluated using:
-
A required minimum percentage reduction
-
A maximum permissible effluent concentration
-
Both a reduction requirement and an effluent limit
-
Other contaminant-specific acceptance criteria
For example, an NSF/ANSI 53 lead-reduction protocol uses a defined challenge concentration and maximum allowable effluent concentration. Other claims may be based primarily on achieving a specified percentage.
Do not apply one universal “NSF reduction requirement” to every contaminant. Find the requirement tied to the exact substance, standard and claim.
Common Calculation Errors
The most frequent mistakes include:
-
Mixing mg/L and µg/L
-
Using the benchmark as the influent value
-
Subtracting the percentage directly from the concentration
-
Comparing an average influent with an unrelated maximum effluent
-
Treating “ND” as a measured zero
-
Ignoring “less than” symbols
-
Rounding too early
-
Assuming “up to 99%” describes every sample or contaminant
If a report lacks enough information to reproduce the basic calculation, treat the percentage cautiously.
What Does Detection Limit Mean on a Lab Report?
A laboratory instrument cannot establish absolute zero. It can only determine whether a substance is detected or quantified above a method-specific threshold.
Limit of Detection, Reporting Limit and Quantitation Limit
Terminology varies, but common terms include:
-
Limit of detection (LOD): The lowest level at which the method can distinguish a substance from background noise
-
Reporting limit (RL): The lowest concentration the laboratory routinely reports as a numerical result
-
Limit of quantitation (LOQ): The lowest level that can be measured with acceptable quantitative confidence
These values may not be identical. The EPA distinguishes analytical detection limits from quantitation limits, with the latter intended to represent concentrations that can be quantified with an appropriate level of precision. Read the method notes to determine which threshold the laboratory uses.
What ND, Non-Detect and “<” Mean
A report may show:
-
ND
-
Non-detect
-
Not detected
-
<1 µg/L
-
<0.001 mg/L
These generally mean the laboratory did not report a measured concentration at or above the stated threshold.
For example, <1 µg/L means the result was below 1 µg/L. It does not prove that the concentration was exactly zero. USGS guidance similarly notes that a non-detect result does not necessarily mean the substance is absent; it means the result falls below the applicable detection or reporting threshold.

Interpreting Effluent Below the Detection Limit
Suppose a report lists:
-
Influent: 100 µg/L
-
Effluent: <1 µg/L
Because the actual effluent is somewhere below 1 µg/L, the filter achieved more than 99% reduction based on that reporting limit:
(100 − 1) ÷ 100 × 100 = 99%
The actual reduction may be higher, but the report does not contain enough information to calculate the exact percentage.
A transparent report should avoid silently substituting zero for the non-detect result.
Why Analytical Methods Matter
Two laboratories can produce different-looking results if they use methods with different detection or reporting limits.
One may report <1 µg/L, while a more sensitive method may report a numerical value below 1 µg/L. This does not automatically mean the second filter performed worse. It may simply mean the second method measured at a lower concentration.
When comparing reports, check:
-
Analytical method
-
Reporting limit
-
Units
-
Sample preparation
-
Whether results are numerical or non-detect
-
Whether the same contaminant form was measured
Claims such as “zero contaminants” or “complete removal” deserve scrutiny unless the report clearly explains the analytical limit. “Below detection” is more precise than “zero.”
Reading NSF/ANSI Standards, Reduction Requirements and EPA Benchmarks
NSF/ANSI standards provide structured methods for evaluating drinking-water treatment products. Each standard has a defined scope, and certification applies only to the claims listed for the specific system. NSF provides separate guidance on the scope and reduction claims covered by NSF/ANSI 42, 53 and 401.
Major Standards You May See
|
Standard |
General scope |
What to verify |
|
NSF/ANSI 42 |
Aesthetic effects, including certain taste, odor and particulate claims |
Exact aesthetic claim and rated conditions |
|
NSF/ANSI 53 |
Specific health-related contaminant reduction claims |
Named contaminant, exact model and claim-specific acceptance criteria |
|
NSF/ANSI 58 |
Reverse osmosis system performance |
Exact RO system configuration and certified claims |
|
NSF/ANSI 401 |
Reduction claims for certain emerging or incidental compounds |
Specific compounds included in the listing |
NSF/ANSI 58 specifically addresses point-of-use reverse osmosis drinking-water treatment systems and includes requirements related to system performance and applicable reduction claims.
Certification to NSF/ANSI 42 does not establish that a filter reduces lead or every other health-related contaminant. Likewise, certification to NSF/ANSI 53 does not mean the system is certified for every contaminant addressed somewhere within that standard.
Always ask three questions:
-
Which standard?
-
Which contaminant claim?
-
Which exact model and configuration?
Challenge Concentration and Maximum Effluent Limits
Standardized protocols may specify:
-
The contaminant concentration entering the filter
-
An allowed tolerance around that concentration
-
Water chemistry and pH
-
Sampling points
-
Rated capacity
-
Maximum effluent concentration
-
Minimum required percentage reduction
For a report to establish that a product passed a particular protocol, its results must be interpreted against that protocol’s acceptance criteria. A high percentage alone is not proof of compliance.
EPA MCL vs. MCLG vs. Certification Requirements
These terms serve different purposes:
-
Maximum Contaminant Level (MCL): An enforceable U.S. EPA limit for a regulated contaminant in public drinking-water systems
-
Maximum Contaminant Level Goal (MCLG): A non-enforceable health-based goal
-
Filter certification requirement: A product-performance criterion established by the applicable standard and claim
The EPA distinguishes MCLGs as non-enforceable public-health goals from MCLs, which are enforceable drinking-water standards.
An MCL may appear in a performance data sheet as a useful comparison, but it is not interchangeable with an NSF/ANSI certification requirement. Filter certification protocols may use different challenge concentrations and acceptance limits.
To evaluate a row correctly:
-
Identify the applicable benchmark.
-
Convert the effluent into the benchmark’s units.
-
Determine whether the benchmark is a maximum concentration or a reduction percentage.
-
Compare the correct result—average, maximum or minimum—with the stated requirement.
-
Confirm that the report marks the result as passing when applicable.
Tested vs. Certified: What Is the Difference?
The difference between tested and certified is one of the most important parts of learning how to read water filter test reports.
What “Independent Laboratory Tested” Means
Independent laboratory testing generally means an outside laboratory evaluated a product sample. The report can be useful if it identifies:
-
The exact model
-
The laboratory
-
The test methods
-
Influent and effluent results
-
Test conditions
-
Capacity
-
Detection limits
-
Pass/fail benchmarks
However, a one-time independent test does not by itself establish product certification or ongoing production oversight.
What “Tested to NSF Standards” Means
“Tested to NSF standards” usually means testing followed or referenced a particular NSF/ANSI protocol. It does not necessarily mean the product is certified.
Similar phrases that require closer inspection include:
-
NSF tested
-
Tested according to NSF requirements
-
Tested in an NSF-accredited or certified laboratory
-
Independently tested to NSF protocols
-
Meets NSF performance levels
Following an NSF/ANSI test method is not, by itself, the same as holding product certification. WQA specifically distinguishes compliance with NSF/ANSI standards from certification by an accredited certification organization. The next question should be: Is the exact product publicly listed as certified by an accredited certification body?
What Third-Party Certification Adds
Formal third-party certification generally includes more than a single contaminant reduction test. Depending on the program and standard, certification may involve:
-
Verification of specific performance claims
-
Evaluation of materials
-
Structural integrity requirements
-
Review of product labeling and advertising
-
Manufacturing-facility assessment
-
Ongoing monitoring or periodic retesting
-
A public product listing
Certification may be issued by organizations such as NSF, WQA or IAPMO. The certifier does not have to be NSF for a product to be legitimately certified to an NSF/ANSI standard, but the claim should name the certifying organization and be verifiable.
How to Verify Certification
Use the official product database of the named certifier. Search by model number rather than relying only on the manufacturer name.
Confirm that the listing matches:
-
Complete model number
-
Cartridge or membrane
-
System configuration
-
NSF/ANSI standard
-
Specific contaminant claims
-
Rated capacity or flow conditions, when listed
-
Current certification status
A logo on a product page is not enough if the model cannot be matched to a public listing. Certification can also apply to a component or material rather than the complete system, so read the scope carefully.

Can a Non-Certification Lab Report Still Be Useful?
Yes. A detailed, traceable report from a competent laboratory can provide meaningful evidence of performance.
Its limitations should still be understood. It may not establish:
-
Ongoing manufacturing consistency
-
Certification of structural or material requirements
-
Compliance beyond the tested sample
-
Performance for untested contaminants
-
Authorization to use a certification mark
The strongest interpretation is precise: the named laboratory tested the identified configuration under the stated conditions and obtained the published results.
How to Use Water Filter Lab Results to Make a Practical Filtration Decision
A laboratory report becomes useful only when it is connected to your water and treatment priorities.
Start With the Contaminants in Your Water
For municipal water, review the local Consumer Confidence Report and consider point-of-use testing when household plumbing or a specific concern may affect tap-water conditions. Private-well owners generally need direct testing because a municipal report does not represent a private source.
Then create a short list of relevant concerns, such as:
-
A regulated contaminant detected in the water
-
A contaminant associated with household plumbing
-
Taste or odor issues
-
Sediment or particulate matter
-
Dissolved substances that require a particular treatment technology
-
Contaminants for which local authorities recommend follow-up
Do not choose a filter based only on the longest contaminant list. Focus on verified performance for substances that are actually relevant to your water.
If your water analysis identifies dissolved contaminants that are appropriately addressed by reverse osmosis, apply the same report-reading criteria when comparing reverse osmosis filter systems from Frizzlife: verify the exact model and configuration, relevant NSF/ANSI 58 or other claims, influent and effluent values, operating conditions, capacity, and certification scope. Review the documentation for each model rather than assuming that one report or claim applies to every system in the collection.
When comparing filtration options, review the documentation for the exact model rather than assuming that one laboratory report, certification, or contaminant claim applies to every system.
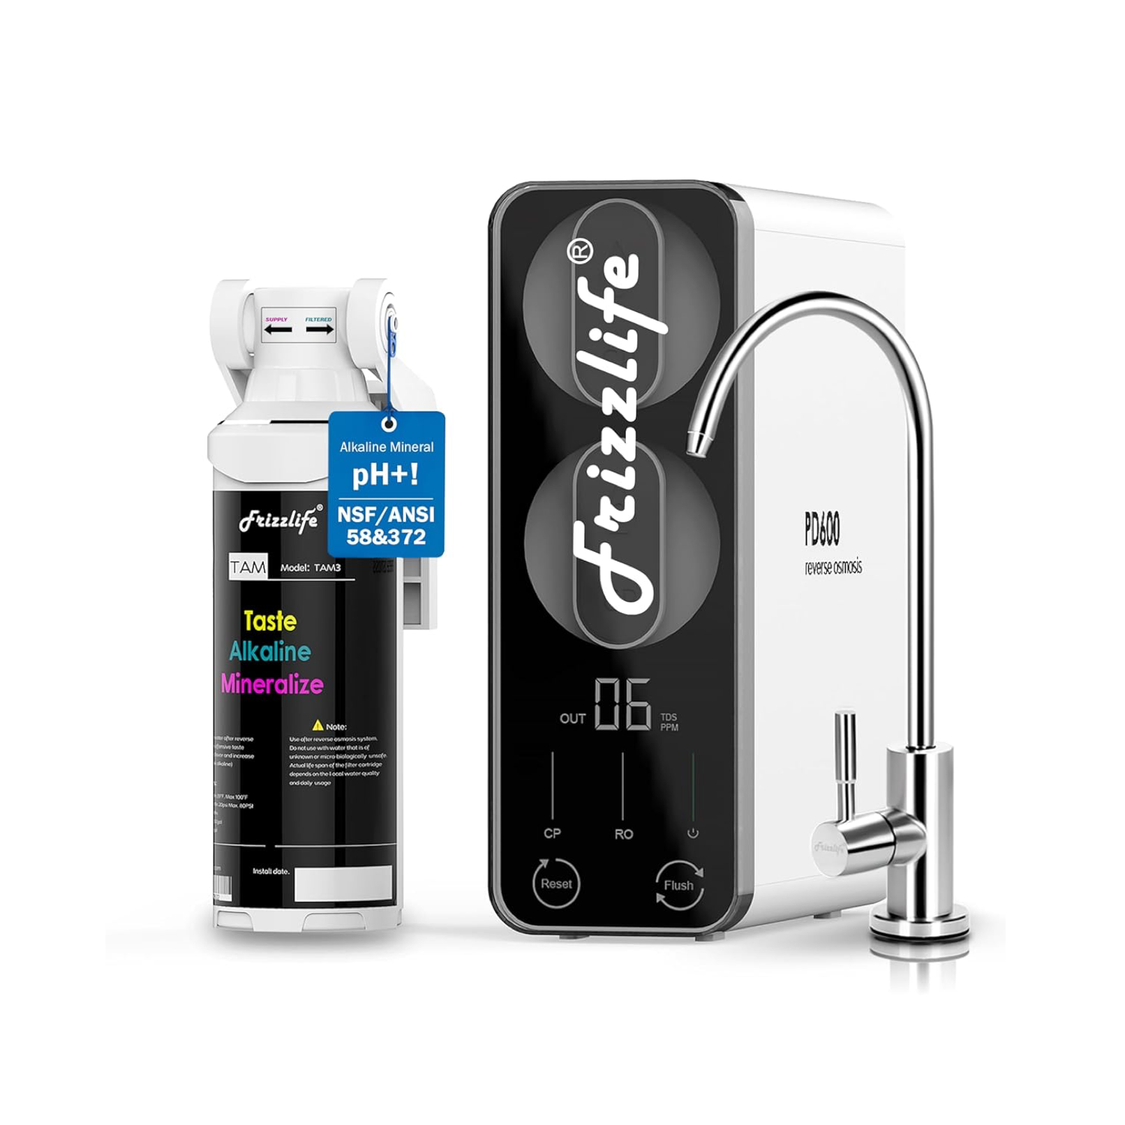 Reverse Osmosis System
Frizzlife PD600-TAM3
Review the exact PD600-TAM3 specifications, filtration information, operating requirements, and available product documentation before matching the system to your water-quality priorities.
View PD600-TAM3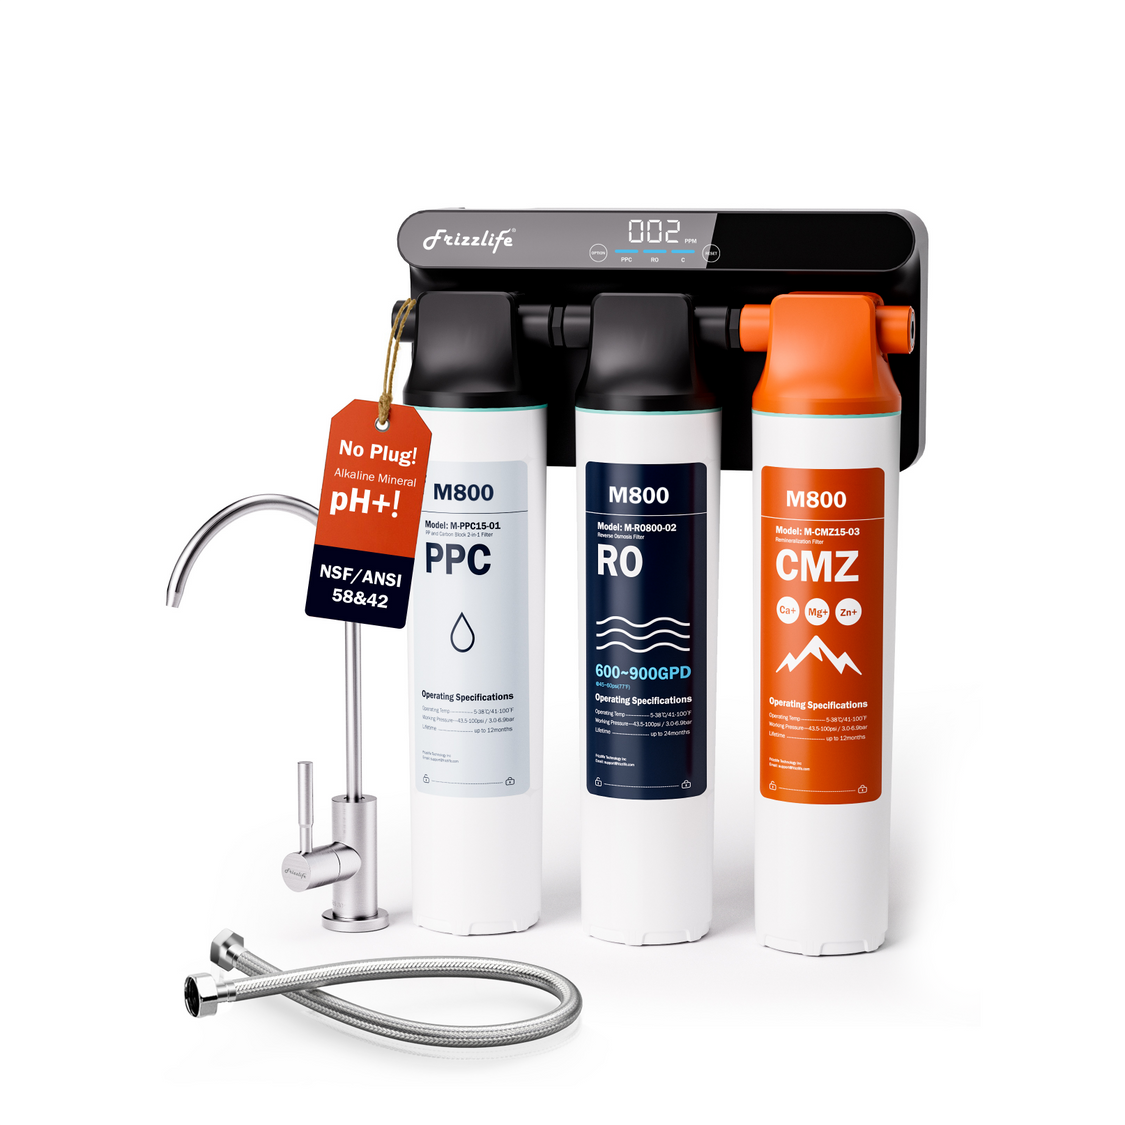 Reverse Osmosis System
Frizzlife M800
Check the M800 product page for its exact configuration, specifications, filtration documentation, and applicable performance information before making a model-specific comparison.
View M800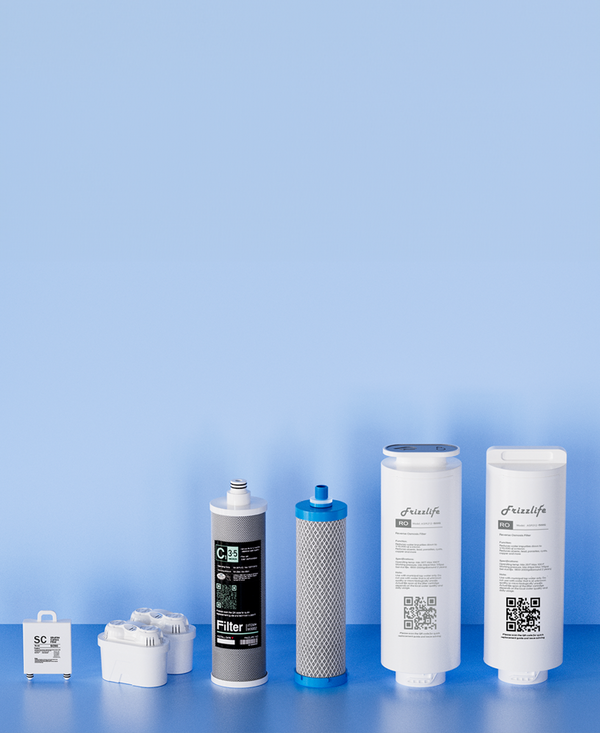 Replacement Filters
Frizzlife Replacement Filters
Filter performance also depends on using the correct replacement cartridge and following the maintenance schedule specified for your exact Frizzlife system.
Find Replacement FiltersSeparate Health-Related and Aesthetic Concerns
Taste, odor, color and visible particles can matter greatly to household satisfaction, but they are not the same as health-related contaminant concerns.
This distinction helps you interpret standards:
-
NSF/ANSI 42 commonly addresses aesthetic effects.
-
NSF/ANSI 53 addresses specific health-related reduction claims.
-
NSF/ANSI 58 applies to reverse osmosis system performance and specified claims.
-
NSF/ANSI 401 covers certain emerging or incidental compounds.
A filter may improve chlorine-related taste while having no verified claim for a contaminant such as lead. Do not infer one form of treatment from another.
Compare Each Relevant Row
For every contaminant that matters to you:
-
Confirm that it is explicitly named.
-
Check the exact tested model.
-
Read the influent concentration.
-
Read the average and maximum effluent.
-
Verify the units.
-
Recalculate the reduction percentage if possible.
-
Identify the applicable NSF/ANSI or regulatory benchmark.
-
Check performance near rated capacity.
-
Note the flow rate, pH and other test conditions.
-
Determine whether the result is laboratory-tested or formally certified.
This row-by-row approach is more reliable than relying on a badge or headline percentage.
Account for Real-World Variables
Laboratory results are produced under controlled conditions. Household performance can be affected by:
-
Source-water chemistry
-
pH and temperature
-
Contaminant concentration
-
Competing substances
-
Sediment and membrane or media fouling
-
Flow demand
-
Filter age
-
Installation quality
-
Maintenance and timely cartridge replacement
If your conditions fall outside those shown in the report or product documentation, performance may differ.
Red Flags in a Water Filter Test Report
Treat a report cautiously if it does not identify the exact model, laboratory, test protocol, influent and effluent values, units, test conditions or rated capacity. Other warning signs include percentage-only claims, unsupported “zero contaminant” language, non-detect results without a reporting limit, and certification claims that cannot be matched to the exact model in the named certifier’s official database.
Why a Lab Report Is Not a Blanket Safety Guarantee
Even a strong report covers only the substances tested, the product identified and the conditions described. It does not prove that unknown contaminants are absent or that a filter can correct every water-quality problem.
Consider follow-up water testing or qualified professional guidance when:
-
A private well may have microbiological contamination
-
Contaminant levels are unusually high
-
Water changes suddenly in color, odor or taste
-
Flooding, construction or plumbing work may have affected the supply
-
A vulnerable household member requires more conservative guidance
-
The available filter report does not address the detected contaminant
-
You need to verify treatment performance at your own faucet
Final Takeaway
To read a water filter laboratory test report correctly, begin with the exact model and test conditions, then connect five values: contaminant, influent, effluent, reduction percentage and benchmark. Check the units, detection limit, lifecycle sampling and footnotes before accepting a headline claim.
Most importantly, keep the distinctions clear: non-detect is not absolute zero, a high reduction percentage does not automatically mean a low enough effluent concentration, and “tested to NSF standards” is not the same as third-party certification. The most useful report is one that lets you trace exactly what was tested, how it was measured, what requirement applied and whether the result is relevant to your own water.
References
https://water.usgs.gov/owq/OFR_99-193/minimum.html
https://www.nsf.org/knowledge-library/nsf-ansi-42-53-and-401-filtration-systems-standards
https://www.nsf.org/knowledge-library/nsf-ansi-58-reverse-osmosis-drinking-water-treatment-systems
https://www.epa.gov/sdwa/how-epa-regulates-drinking-water-contaminants
https://wqa.org/grow/product-certification/
https://www.nsf.org/news/drinking-water-treatment-units-stricter-requirements-lead-reduction-cert